
Fields Data Collection
Admin web & iOS mobile - 2023

Company
Indigo Ag
Product components
3 responsive web UIs for admin users and 3rd party coordinators, and an iOS app for field technicians to input data
My role
Lead UX Designer
Primary team
Project managers, Back-end engineers (4), Front-end engineers (6), iOS engineers (2), Tech leads
Project description
Indigo’s primary goal as a business is to enroll farmers in a sustainability program which incentivizes them to implement certain practices (no-till, rotational grazing, planting cover crops, etc.). Farmers can improve their soil health, produce higher quality crops, and also earn supplementary income if they adopt these practices. The only way to validate these efforts is through soil-sampling and other types of field-level data collection. The Fields Data Collection project is a completely new suite of tools spanning admin web interfaces and native mobile components to enable this end-to-end workflow.
Goals
Develop a streamlined and integrated toolset to replace the current fragmented systems
Reduce number of failed soil samples and logged support tickets
Increase sampling efficiency to at least 80% completion of selected fields
Speed up the data collection process for field technicians

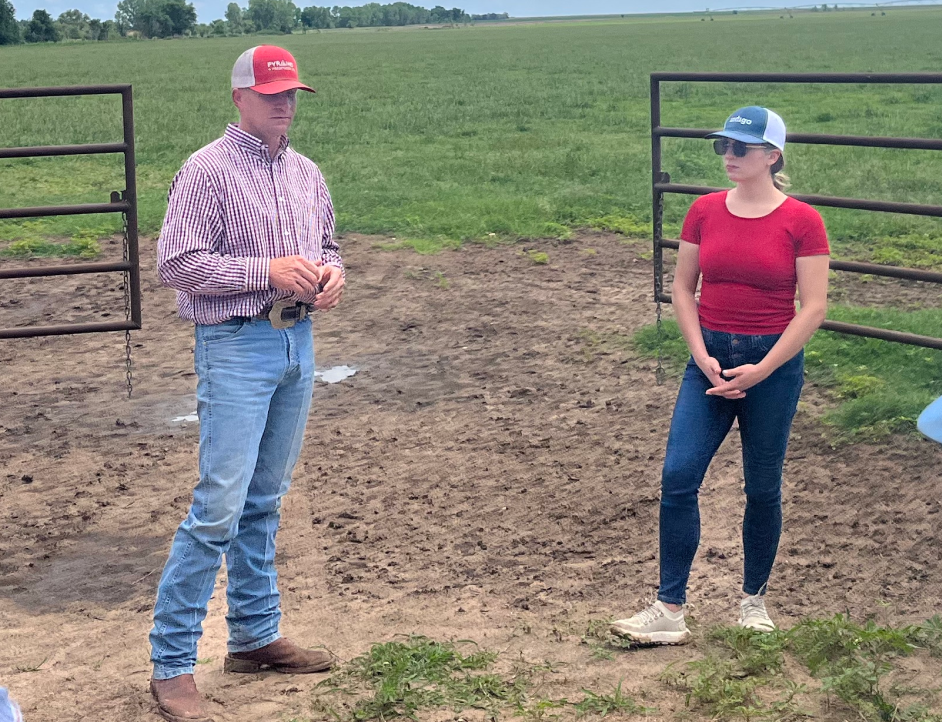
Testing the mobile app in the field with users June 2023
The design challenge
Create an admin experience where Indigo Ops could organize soil sampling tasks, manage grower outreach for field visits, and assign fields to 3rd party soil sampling companies
Create another UI where 3rd party vendor companies can assign individual tasks to their team of field technicians based on geography and team logistics
Design a complementary iOS mobile experience where field technicians can complete their assigned tasks and easily enter complex field data
The process

Jobs to be done exercise
Following the Jobs to Be Done framework, I assessed the core user needs across the various user types that we would need to support with our suite of tools.


The outcome of this exercise was that we were able to clearly define the user needs and translate them into product requirements.
This diagram shows the overall architecture of the Fields project and how it was all connected.
2. Wireframing

Once requirements were established I began lo-fi designs and wireframes.
These visual assets helped further the discussion with my engineering partners who were building an entirely new back end. Staying in lock step in terms of information architecture and logic was a key component during this stage of development.
3. Prototyping and usability testing

I ran a usability test with 6 users to validate designs before engineering work began
Goals
Validate concepts around the users’ understanding of tasks and how to complete them.
Explore / test UI designs to understand if the new tool is usable and if we can improve anything
High level outcomes
Gained a deeper understanding of the field technician mental models
Validated the first phase of designs for users doing soil sampling
Generated ideas for future additions and improvements such as:
More sophisticated navigation UX
Ample and timely feedback for successful data submission or errors
More emphasis on information that is most important to users
Addition of soil sample shipping info to laboratories for easy lookup
“One thing that would be good on this is an arrow showing which direction you’re going to on your little GPS thing because I get disoriented so I’ll drive in circles for a second to see which way I’m moving.”
“I like the part that it actually tells you what kind of point it is instead of what the color is and the shapes it, it helps out a lot.”
“I would probably want to see the bulk density under the carbon sample stuff and then the texture pH under the bulk density, that’s the order of operations in which they go.”
4-5. Hi-fi designs rolled out to engineering in increments

Example segment from my design tracker page in Confluence
Throughout this project I maintained a comprehensive design tracker which documented each phase of design
Each week I would review a new section with the team and we would sign off on things together before engineering began building
In addition to hosting a weekly design review meeting I also left detailed notes in my designs to describe intended behavior, interaction, and different states and variations for components
Later, I would test and review each build (on web or mobile) and provide feedback

Example of design documentation and artifacts

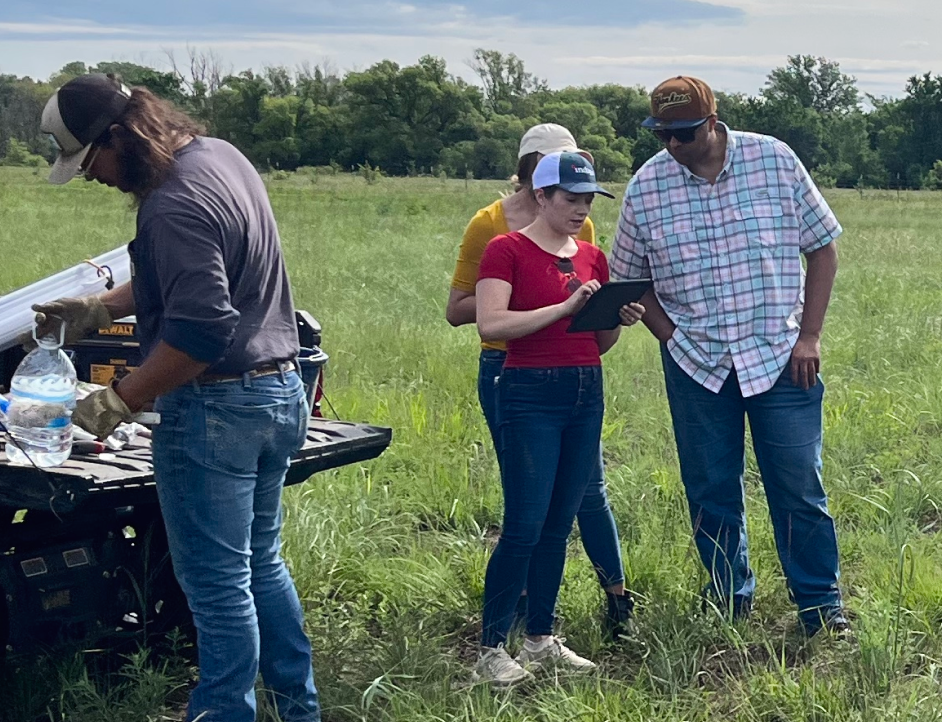
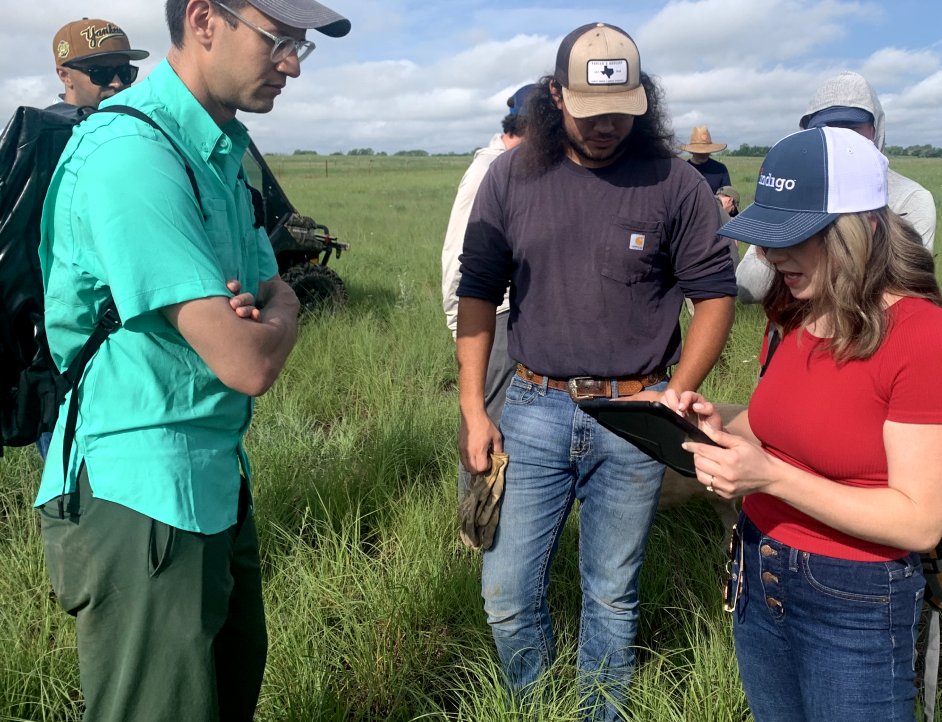
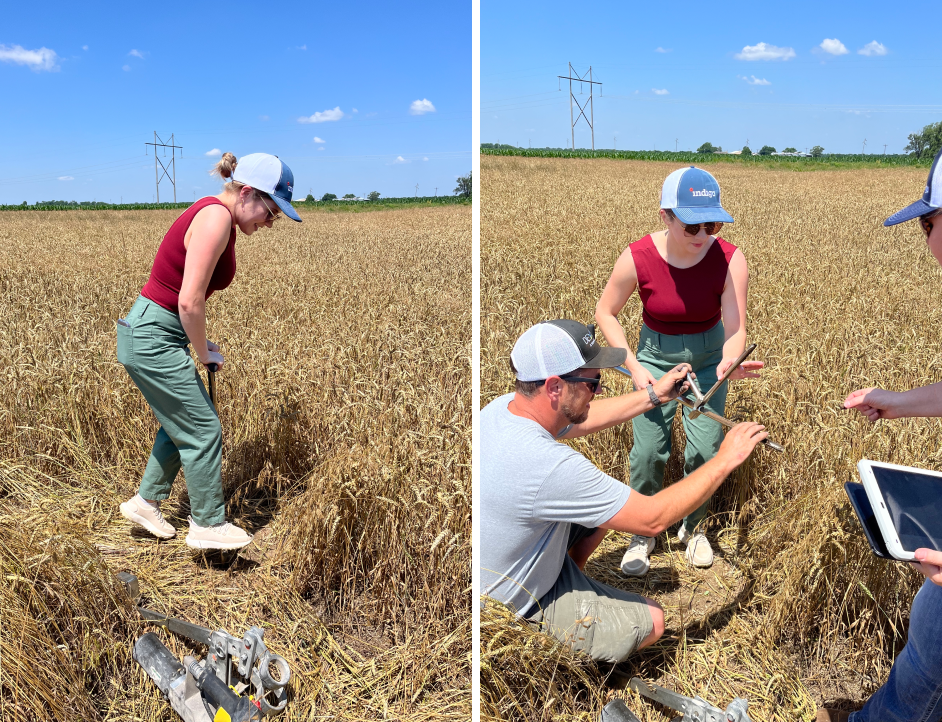
6. In-person user testing , Kansas June 2023

Once all basic elements were built, 8 members of my team traveled to Kansas to test our end-to-end product with users
Goals:
Observe how field technicians conduct soil sampling in real life and participate in the process
Validate the current user flow and experience of the mobile app and the task manager web UI
Test all anticipated edge cases

Outcomes

Debriefing after the trip and using orange peels to describe soil sampling points
The team drafted long list of bugs and UX improvements
All high priority items have been completed by one month
We have continued communicating with users to gather additional feedback as we address all the feedback items
We gained a lot of confidence in the new tools!
Final designs
Mobile iOS experience on iPad
Admin experience for desktop web


Next steps
The Fields data collection suite will be available for the Fall 2023 soil sampling season
The team continues to share updates with users in order to get additional feedback
We have improvements and feature enhancements in the pipeline
The next goal is to adapt these tools to support Indigo’s Source data collection efforts which center around gathering irrigation and grazing data